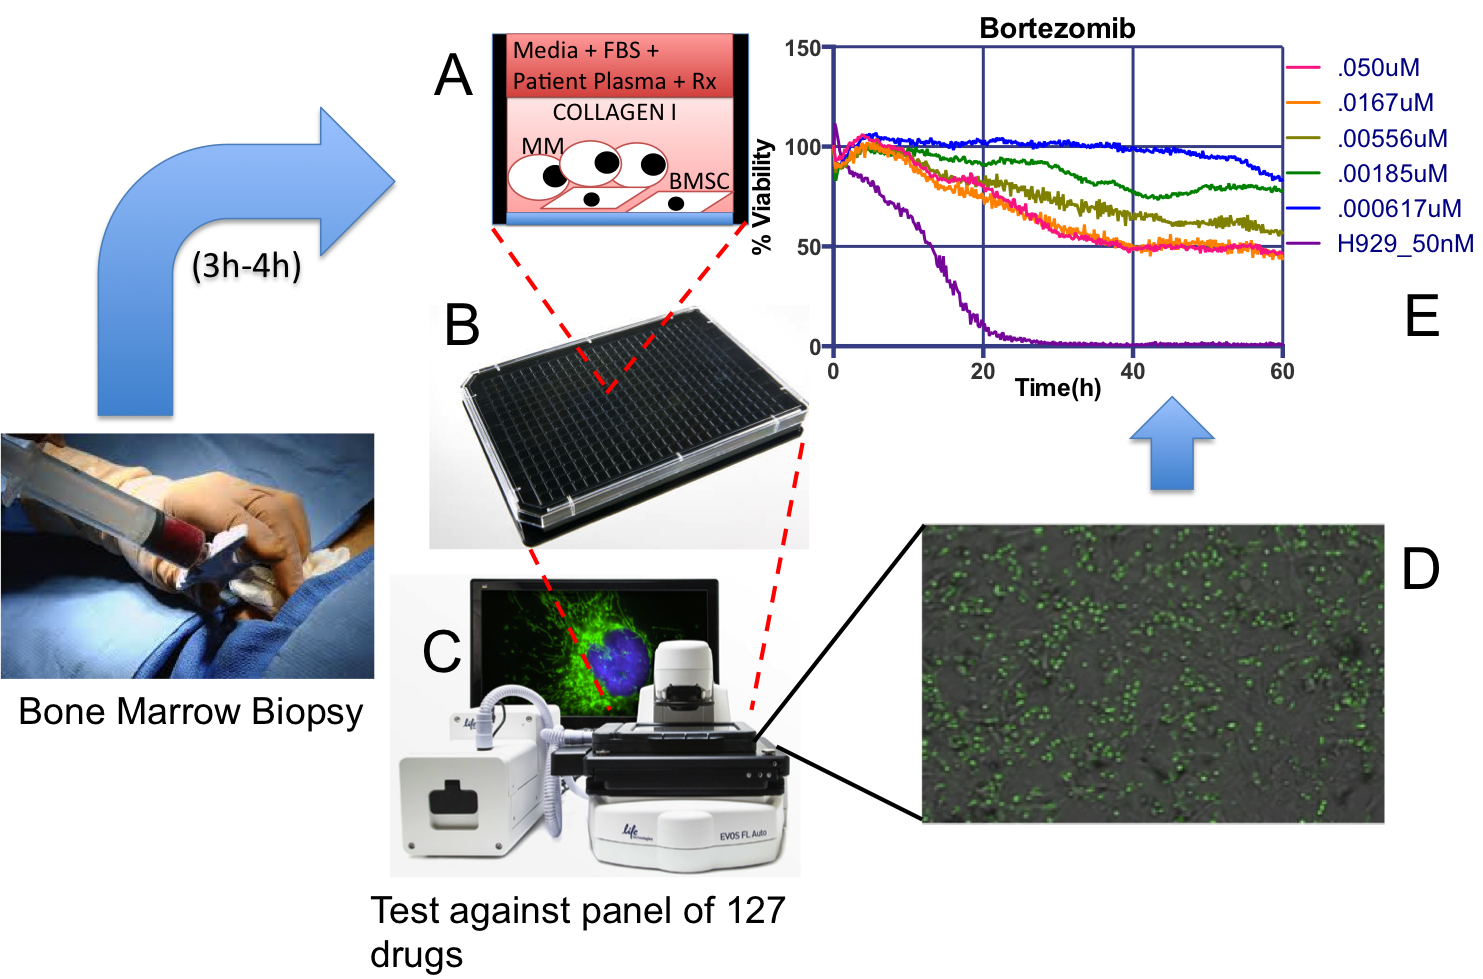
EMMA is a unique ex vivo drug sensitivity assay where patient-derived Multiple Myeloma cells, from a standard-of-care bone marrow, are co-cultured in 384- or 1,536-multi well plates, and exposed to up to 127 different drugs and combinations (A-B).
Each plate is imaged for a period of one week in a digital motorized microscope equipped with bench top incubators (C). A novel digital image analysis algorithm detects live cells and drug-induced cell death, which generates patient-specific drug sensitivity profiles to generate patient/drug-specific models of clinical response to therapy (D-E).
In order to unravel the transcriptomic topology of a complex disease like MM, we employed RNA-seq data from 844 patients to identify modules of co-expressing genes using a robust dimensionality reduction technique and an efficient clustering method. Z-normalized expression of 16,738 genes across 844 MM patients is used to identify clusters of co-expressing genes that are likely to play disease-specific functional roles. We use ex vivo drug sensitivity data for each drug from EMMA, to identify clusters that are enriched for resistance and sensitivity using gene set enrichment analysis (GSEA). The genes in these clusters not only correlate with resistance/sensitivity, they also co-express among themselves, thereby implicating them in a pathway/mechanism, or a common upstream regulator.
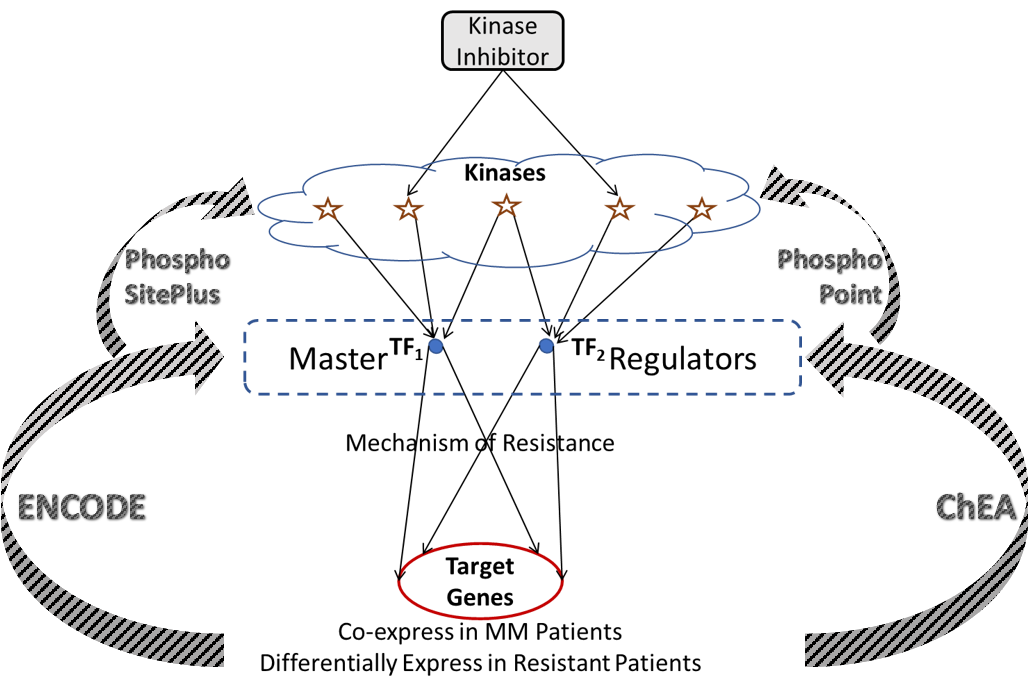
We programmatically construct gene regulatory networks that connect druggable kinases to target genes. These two layers of the network are connected by a layer of transcription factors that act as putative master regulators in driving mechanisms of resistance, and are phosphorylated by several druggable kinases, thereby providing a mechanism to pharmacologically reach the target genes. As genome-wide regulatory networks haven’t yet been developed with reliable accuracy, we utilize several publicly available databases to infer connections between target genes, transcription factors, and kinases. ENCODE and ChEA are two such sources providing extensive data linking transcription factors to target genes from genome-wide ChIP-X experiments. This information is used to identify upstream transcription factors for the target clusters, where the percent number of genes that a given transcription factor binds to within each cluster is estimated for all transcription factors. A reasonable threshold for binding affinity, or coverage of each cluster is set (68.25%; the area under a normal distribution within one standard deviation of the mean) and transcription factors with coverage greater than the threshold are said to be upstream of that cluster. Each of these transcription factors maybe phosphorylated by several kinases, which is inferred from publicly available proteomic databases PhosphoSitePlus and PhosphoPoint. This leads to a hierarchical network that forms a cascade of target genes, transcription factors, and kinases.
We developed a novel biophysical model that accounts for transcription, translation, and post-translational modifications from first principles and assume steady state to develop a functional relationship between gene expression of transcription factors and kinases, and target genes. Moreover, the model includes patient-specific rate constants for ribosome, protein degradation, RNA synthesis, and RNA degradation; which are all known KEGG pathways that have single-sample GSEA (ssGSEA) scores that represent enrichment of each of these pathways in a given patient. We model these patient-specific rate constants as a function of that patient’s ssGSEA scores. The 844 MM patient cohort is equally divided into training and validation cohorts, where the model parameters for each target gene are estimated by fitting the proposed biophysical model to the target gene expression. The estimated model parameters are used to predict target gene expression and are correlated with actual gene expression for the validation cohort.
We have collated a comprehensive list of over 250 kinase inhibitors and their respective primary targets, which is obtained from vendors (e.g. SelleckChem) and literature. The effect of each kinase inhibitor will be simulated by silencing the corresponding kinases in the network listed as primary targets and estimating the target gene expression for all the target genes. The effect of the kinase inhibitor is quantified using a normalized enrichment score (NES) for each cluster using a running-sum statistic of the log2(fold-change) of gene expression in a ranked-list of genes from highest log2(fold-change) to the least. Next, we rank the clusters based on their NES to determine specificity of the candidate kinase inhibitor’s effect. The candidate kinase inhibitors that influence the expression of target genes the most are identified using the NES rank of the target cluster.
